
When the Numbers Don’t Add Up
There's a question I ask in almost every school I work with, and it lands quietly at first.
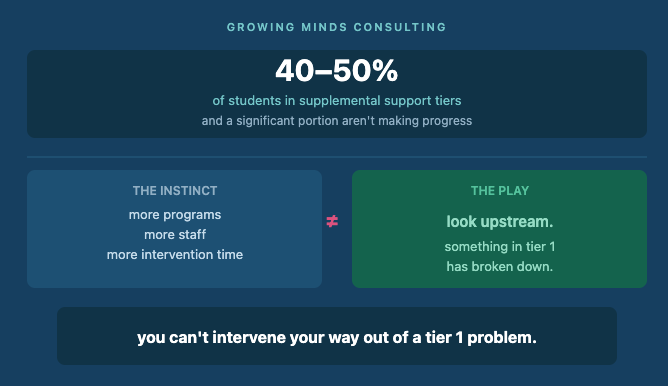
If 40 to 60 percent of your students are receiving supplemental support — and a significant portion of them aren't making progress — what's your next move?
Most people look at each other. Then someone says something like, we need more intervention capacity. More programs. More staff. More time.
I understand the instinct. But that's not the play.
The problem, in almost every case I've seen, isn't that the school needs more intervention. The problem is upstream — and more intervention won't fix it. Before I explain why, there's a foundational piece that changes how you read everything else.
Tiers describe resources, not students
This is the reframe I come back to more than almost any other in my work, and it shifts the entire conversation.
The tiers in an MTSS model are not categories of children. They're not labels for who a student is or what they're capable of. They describe resource allocation: how much instructional time, how much targeted support, how much intensity a system deploys at each level.
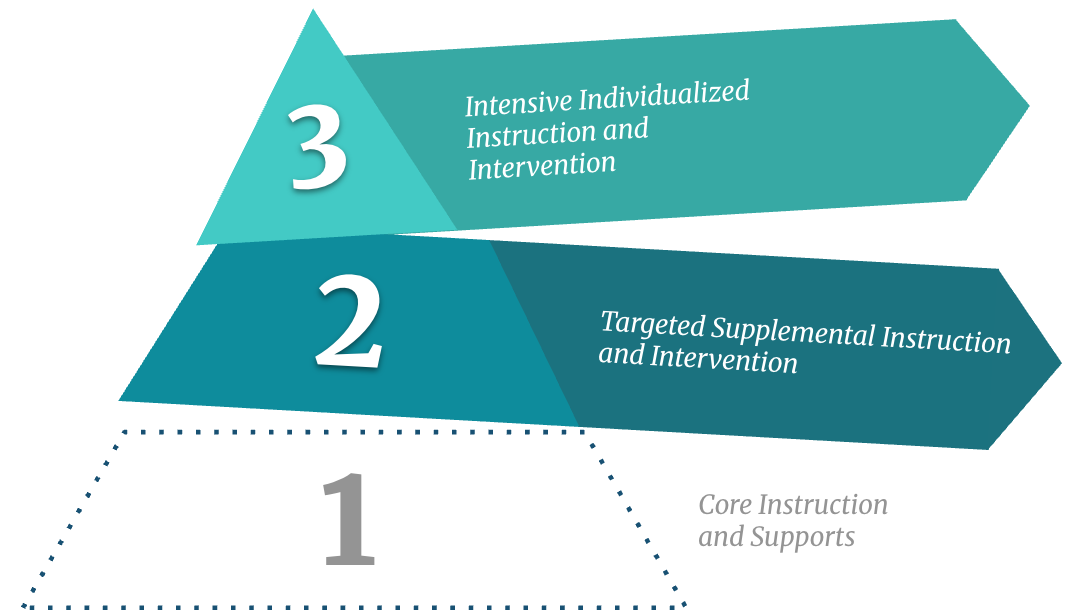
Tier 1 is where the most resources live: the most instructional time, the most materials, the most human contact, the most money, the most opportunity to learn. Supplemental support at Tier 2 is additional and targeted, beyond what core instruction provides. Tier 3 is intensive, individualized, and expensive in every sense of the word.
The pyramid narrows as you move up because the system has progressively fewer resources to deploy at each level. That's the design. That's the load-bearing logic of the whole structure.
And that logic only holds if the base is doing its job.
What the inverted pyramid is actually telling you
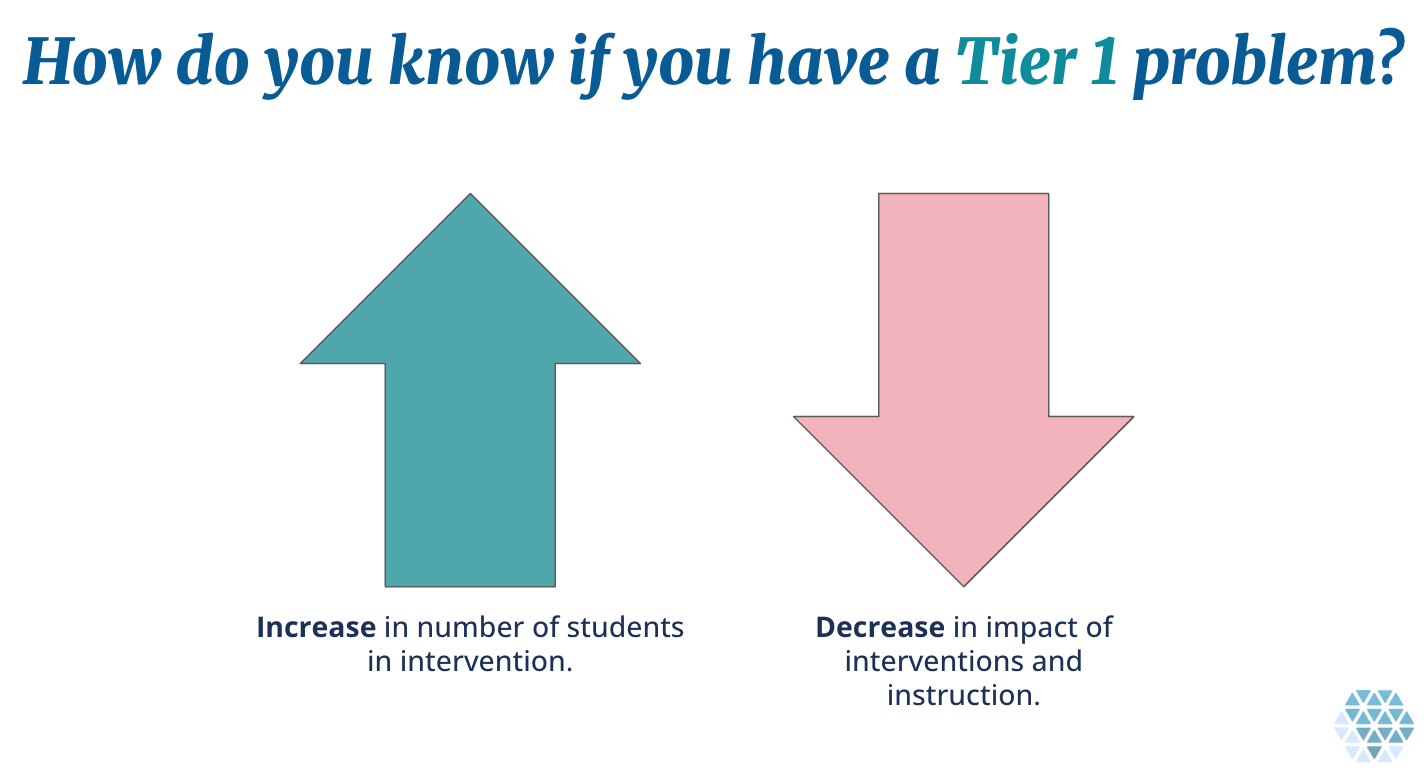
When a school has 40 to 60 percent of students in supplemental tiers, that number is a signal. Usually, it’s not a signal that the school has more struggling students than average. Instead, it’s a signal that something upstream has broken down.
Research on intervention intensity establishes that approximately 5 to 10 percent of the general student population requires the most intensive levels of support (Fuchs, Fuchs, & Malone, 2017). That number refers specifically to the students who need intensive, individualized Tier 3 support — the narrowest point of the pyramid. When a school has four or five times that percentage receiving even supplemental Tier 2 support, the system isn't identifying more students in need. It's signaling that core instruction isn't reaching them in the first place.
More students being serviced in supplemental tiers, with less and less impact to show for it. Not because educators aren't trying. Because the system was never designed to work this way.
You can't intervene your way out of a Tier 1 problem.
What Tier 1 actually means — and what it doesn't
Before I go further, I want to name something that often gets conflated with the inverted pyramid problem, because it's genuinely different.
High-quality Tier 1 instruction is not identical at every school, and it shouldn't be. A school serving a large population of multilingual learners, or students from communities with less access to early academic support, may appropriately provide more explicit, more scaffolded, more language-rich core instruction than a school with a different population. That's not intervention. That's responsive Tier 1 doing exactly what it's supposed to do.
I lived this at Maplewood Elementary, where I served as both the curriculum and literacy coach and the RtI chair. Our principal made a deliberate, school-wide decision to add Fundations phonics instruction for every student in kindergarten through third grade — thirty to forty-five minutes per day, in addition to the ninety-minute reading block. Every student was pretested, organized by level, and sent to a teacher delivering Fundations at a specific pace.
It looked intense. It was intense. And it was absolutely not Tier 2 supplemental support.
I had to defend that position more than once. Other coaches and teachers pushed back: Fundations is an intervention program. Students were grouped by level for delivery. The instruction was additive, not replacing the reading block. Didn't that make it Tier 2?
No. And the reason matters.
The question that actually determines the tier is this: Is this above and beyond what every single other student in this building is receiving? If every student gets it, it's Tier 1 — regardless of the program name, regardless of how it looks from the outside, regardless of whether students are grouped by level for delivery purposes. The grouping at Maplewood was organized for efficient delivery. It did not identify students with deficits requiring targeted support beyond what their peers received.
The program doesn't determine the tier. The structure, universality, and decision-making process do.
At Maplewood, the students who still weren't responding after one full years of that richer, more intensive Tier 1 were the students whose needs were genuinely beyond what core instruction — even well-calibrated, population-responsive core instruction — could address. Because the system was functioning, we could actually see them. And because we could see them clearly, the data we collected on them meant something.
That last part is what Part 2 of this series is about. When the system isn't functioning, the data it produces can't answer the questions that matter most — and the cost of that isn't just wasted resources or staff fatigue.
The cost is a child.
So what do you do when your numbers look wrong?
If your school has 40 to 50 percent of students in supplemental support tiers, the answer is not more intervention capacity.
The answer is a hard look at Tier 1.
Is core instruction actually calibrated to the population your school serves? Not the population the curriculum was designed for somewhere else — your students, in your building, with the language backgrounds and prior experiences they bring through the door every day?
A few questions worth sitting with as you look at your data:
Where are students not responding? Is the pattern concentrated in specific grade levels, specific classrooms, or spread across the building?
What does Tier 1 actually look like in terms of instructional time, materials, and teacher-directed instruction? Is it consistent across classrooms?
When students are placed in supplemental support, is the intervention targeting a precisely identified need — or are you just using the program the school happens to have?
If the answer to that last question is the latter, that's worth pausing on. Check out this post on coherent math intervention systems for more on what strong Tier 2 design actually requires, including how to identify the priority educational need that should be driving intervention decisions.
The goal isn't a perfect pyramid with exactly 80/15/5 percent at each tier. The goal is a system where the data you're collecting actually tells you something true about what students need — and where non-response means something you can act on with confidence.
That kind of system doesn't happen by accident. And it doesn't happen by adding more intervention.
Fix the base of the pyramid first.
Part 2 of this series — What Compromised Data Costs a Child — is coming soon. If you want it in your inbox, subscribe here.
At Growing Minds Consulting, I help schools build MTSS systems that function the way they're supposed to — so that when a student isn't responding, the data means something. If you're looking at your numbers and wondering whether you have a system design problem, I'd love to talk.
References
Fuchs, L. S., Fuchs, D., & Malone, A. S. (2017). The taxonomy of intervention intensity. Teaching Exceptional Children, 50(1), 35–43.